
One-line matplotlib plots and themes for notebooks and scripts.
kx is a small, plain-Python package with .mplstyle themes, palettes and colourmaps. It needs nothing beyond
matplotlib, numpy and pandas and works offline, so it also runs in Kaggle competition notebooks.
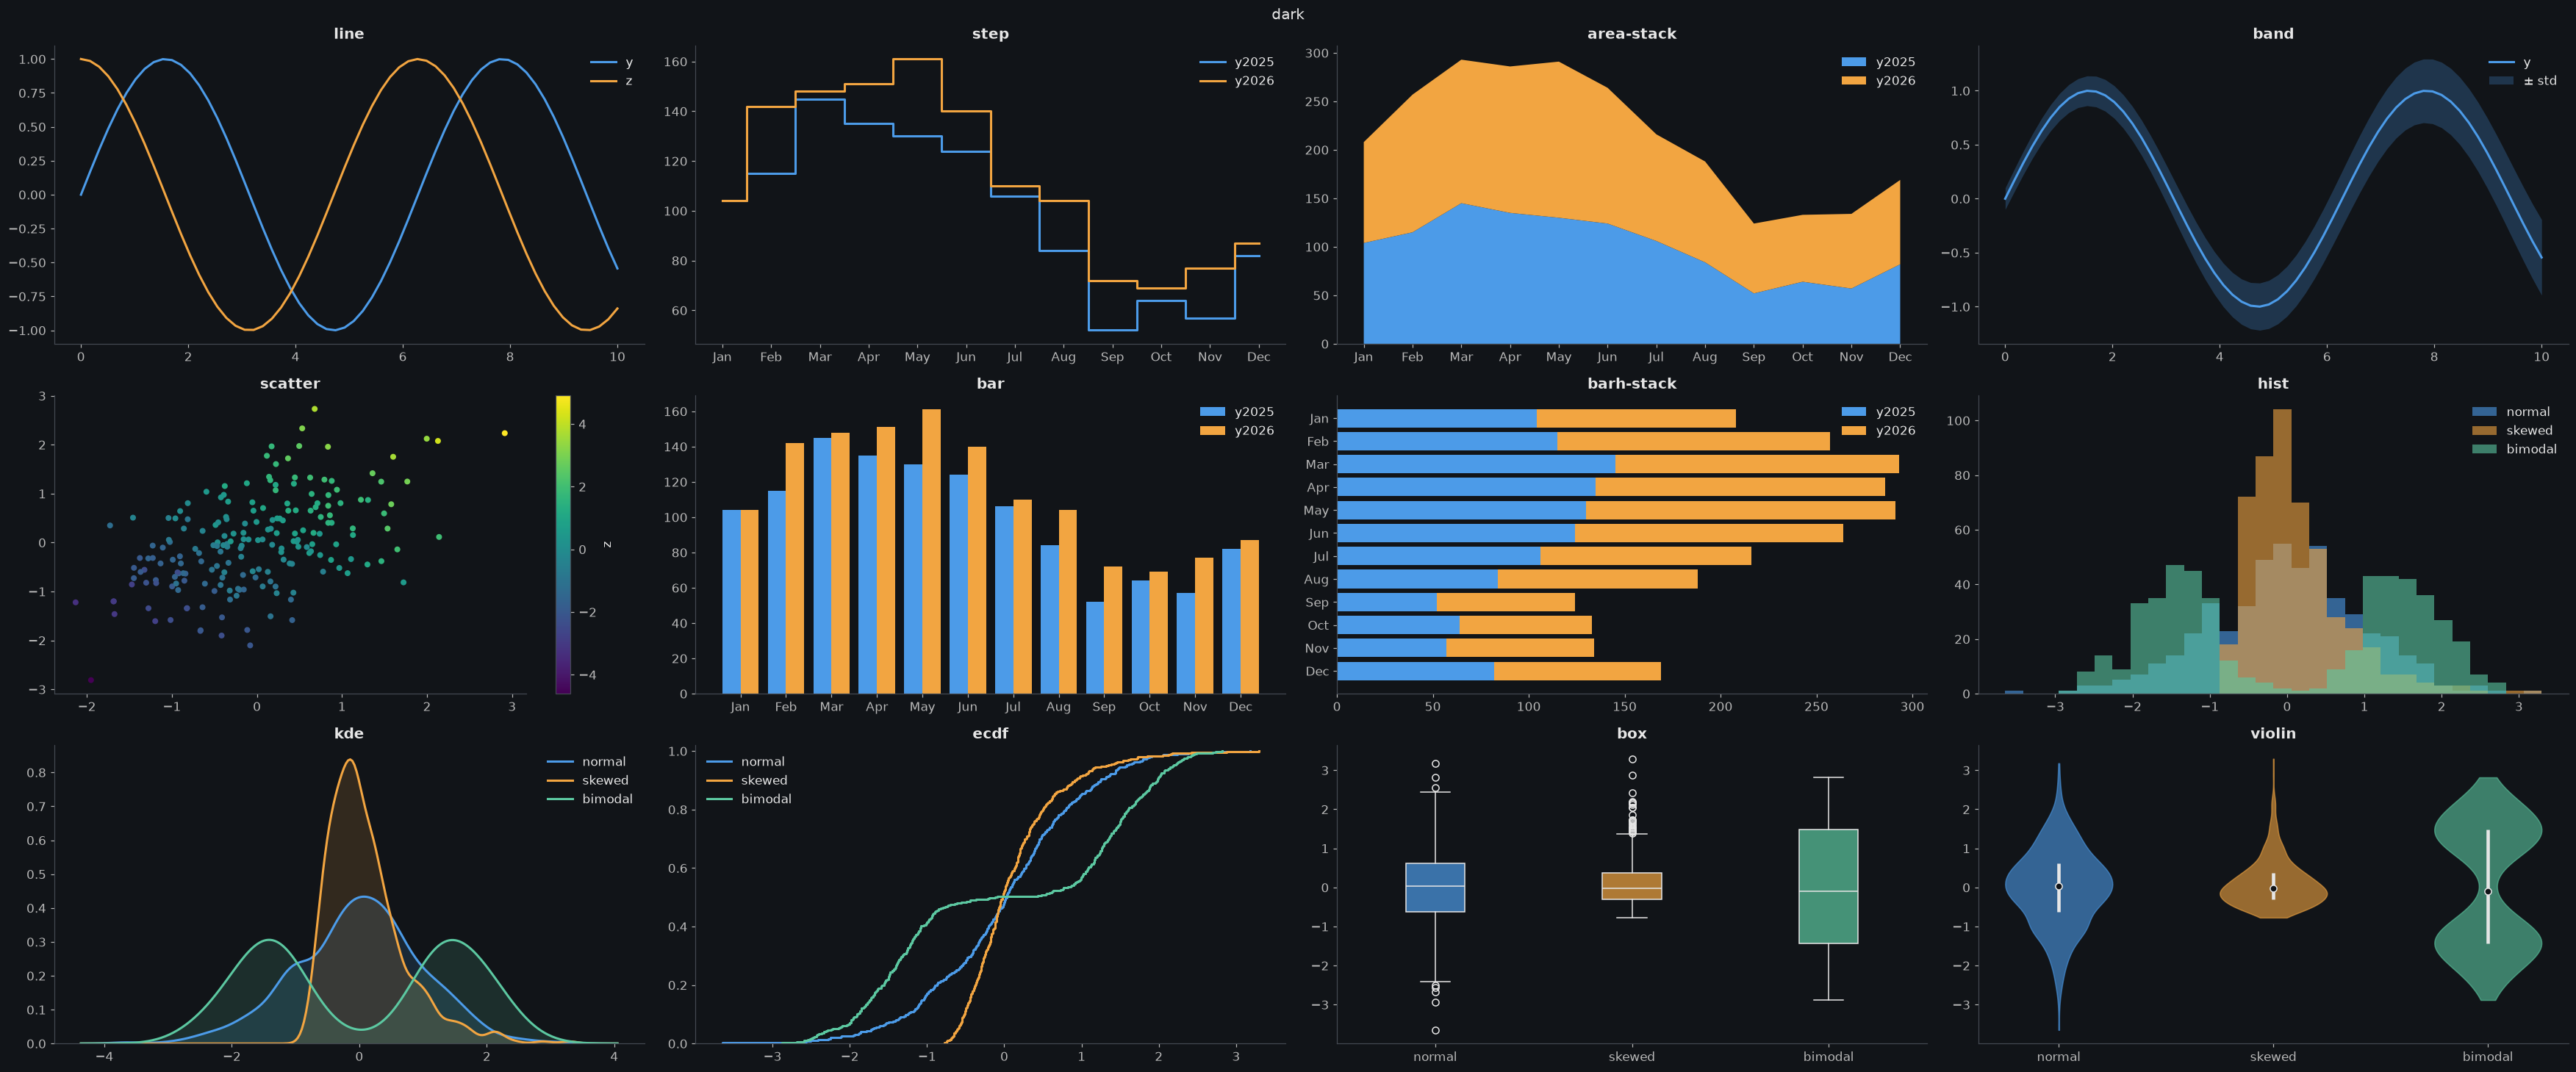
pip install kx-plotimport kx; kx.use('dark')Attach the dataset instead (Add Input → Datasets → vhrabar/kx-plot), then:
import sys; sys.path.append('/kaggle/input/datasets/vhrabar/kx-plot')
import kx; kx.use('dark')kx.use('light', palette='okabe', cmap='cividis') # notebook default: theme, palette, colormap
kx.plot(x, y, z, 'scatter-grid-leg') # spec: kind-theme-flag-...
kx.plot(x, y, 'bar-paper') # a theme in the spec applies to this plot only
with kx.context('paper'): ... # or to every plot in the block
kx.save('fig.png') # to /kaggle/working on Kaggle, else the current folder
for ax, col in zip(kx.grid(3), df.columns): # a figure of 3 panels, a flat array of axes
kx.plot(df, col, spec='hist', ax=ax)
kx.plot(df, 'month', 'y2025', 'bar') # DataFrame columns by name
kx.plot(x, y, 'line', linewidth=3) # other keywords go to matplotlib
kx.plot(df, 'value', spec='kde', by='group') # one density curve per group
kx.plot(df.value, spec='box', by=df.group) # one box per group (also ridge, violin, qq)| Token | Values |
|---|---|
| kind | line step area band scatter bar barh hist kde ridge ecdf box violin |
strip qq count crosstab hexbin heat missing nullmap |
|
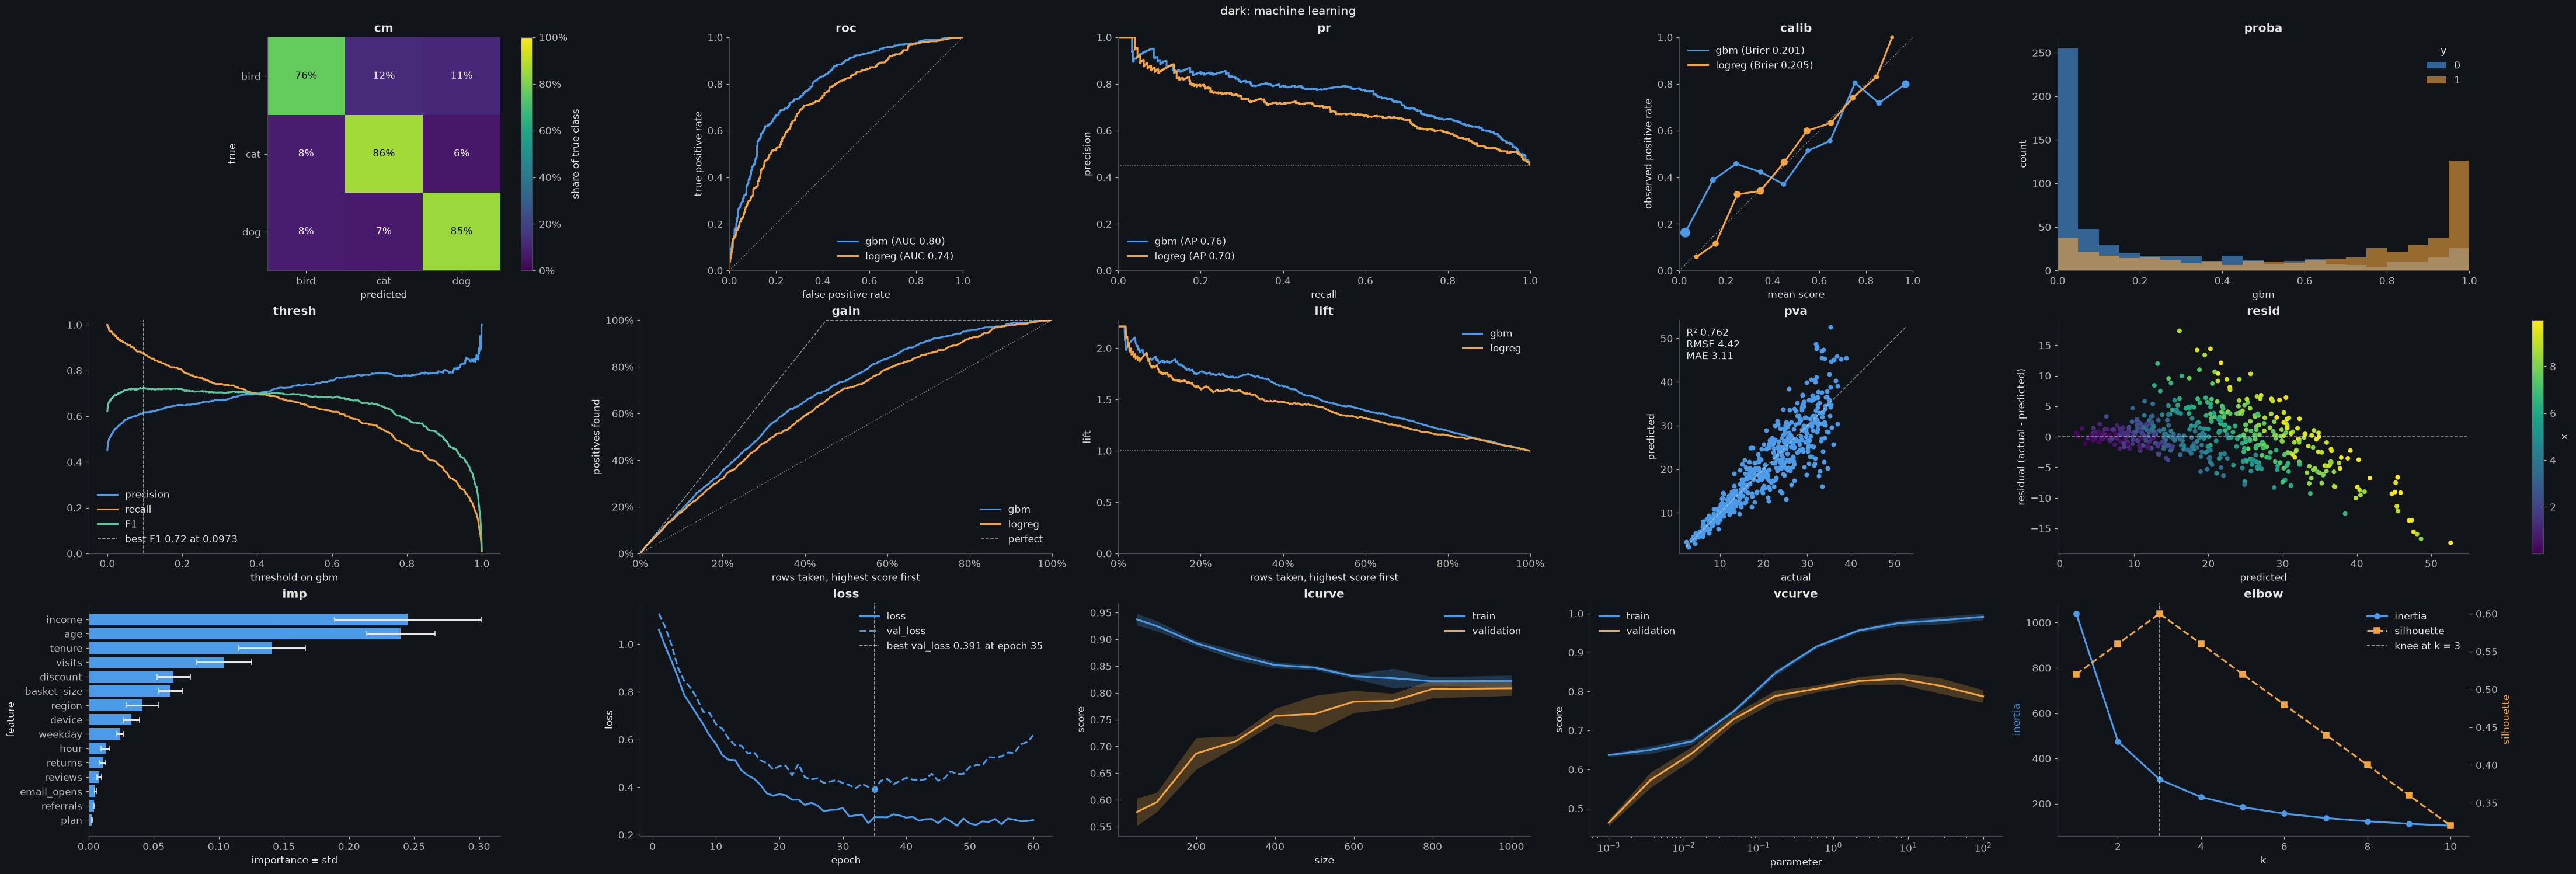
ML: cm roc pr calib proba thresh gain lift pva resid imp loss |
|
lcurve vcurve elbow |
|
| theme | dark light paper science talk poster thesis |
| flags | grid leg legout tight rot wrap logx logy logxy symlogy zero eq pct |
si; per kind: stack norm cum date mk sort ann mean median nocb sym |
|
logc corr all diag fit best |
stack works with area, bar, barh and hist. norm is a 100% stack for area and a
density (area 1) for hist. cum makes hist cumulative; hist-norm-cum is the CDF.
hist puts every series on the same bins, so the bars line up.
diag adds a dashed y = x line to scatter and hexbin; fit adds a least-squares line to scatter, with
its slope and R² in the legend (one line per group with a categorical z).
Unknown tokens raise an error instead of being guessed, with the closest valid tokens as a hint.
Everything is inspectable: kx.grammar(), kx.grammar('area'), kx.parse('leg-scatter'), kx.show('dark'),
kx.source('scatter').
kx.load('passengers') is a demo table with numbers, categories and NaNs to try these on.
kx.missing(df)                                     # share of NaNs per column, the most missing on top
kx.plot(df, 'nullmap-sort')                        # where the NaNs are: one pixel row per table row
kx.plot(df, 'heat-corr-ann')                       # correlations of the numeric columns, -1 to 1
kx.plot(df, 'heat')                                # any numeric DataFrame or 2-D array as coloured cells
kx.plot(df, 'pclass', spec='count', by='survived') # rows per category, split by a second column
kx.plot(df, 'pclass', 'port', 'crosstab-norm-ann') # how often each pair of categories occurs
kx.plot(df, 'age', 'fare', 'hexbin-logc') # points per hexagon; with a z, its mean per hexagonheat, missing and nullmap take the whole table and no column names; kx.plot(df[cols], 'heat') for some
columns. wrap breaks long tick labels onto several lines.
kx.load('binary'), 'multiclass', 'regression', 'history', 'importance' and 'curves' are demo data for
these kinds. Metrics are computed in numpy: no scikit-learn needed.
kx.plot(y_true, score, 'roc')                      # ROC curve, AUC in the legend
kx.plot(y_true, gbm, logreg, 'pr')                 # a second model goes in z; AP and a random baseline
kx.plot(y_true, proba_df, 'roc')                   # a 2-D score: one curve per class, one-vs-rest
kx.plot(y_true, score, 'calib')                    # reliability diagram, Brier score in the legend
kx.plot(y_true, score, 'proba')                    # score histogram per true class
kx.plot(y_true, score, 'thresh-best')              # precision, recall and F1 against the threshold
kx.plot(y_true, score, 'gain')                     # also 'lift'
kx.plot(y_true, y_pred, 'cm-norm-ann')             # confusion matrix, each row the recall of a class
kx.plot(actual, predicted, 'pva')                  # predicted vs actual, R², RMSE and MAE
kx.plot(actual, predicted, feature, 'resid')       # residuals, coloured by a feature
kx.plot(df, 'feature', 'importance', 'std', 'imp') # feature importance with error bars, top= 20
kx.plot(model.fit(...), 'loss-best')               # training curves from a Keras History, dict or DataFrame
kx.plot(sizes, train_scores, val_scores, 'lcurve') # scikit-learn's learning_curve output; also 'vcurve'
kx.plot(ks, inertia, silhouette, 'elbow-best')     # choosing k, the knee marked
kx.roc_auc(y_true, score), kx.pr_ap(y_true, score) # the metrics as numbers
kx.evaluate(y_true, gbm, logreg)                   # a report: the panels picked from the data
The truth comes first, then the predictions. Binary labels are 0/1 or bool, with 1/True the positive class;
with two other labels the later one in sorted order is positive. For multiclass, pass a 2-D score with one column
per class: the class names are the DataFrame's columns, or else the sorted labels of y_true. roc, pr, calib,
gain and lift draw their legend without leg, because the metric in it is the point of the plot.
kx.evaluate(y_true, *scores) draws roc, pr, calib and proba for a binary task, roc, cm and
proba for a 2-D score, and pva, resid and a residual hist for a numeric y with many values. It returns
the flat array of axes, like kx.grid; spec='dark-grid' styles every panel.
rcParams can be overridden in kx.use with __ for dots: kx.use('dark', figure__figsize=(8, 4)).
Every kind, option, flag and config, with its output, is in the Example Usage notebook.
Palettes for kx.use(theme, palette=...), they swap only the colours; a theme's
other cycled properties (such as paper's linestyles) stay.
| Name | Source |
|---|---|
okabe |
Okabe & Ito (2008) |
tolbright tolvibrant tollight |
Paul Tol |
tolhc tolmc |
Paul Tol |
petroff6 petroff8 petroff10 |
Petroff (2021) |
tab10 tab20 tableaucb |
Tableau |
set1 set2 dark2 paired |
ColorBrewer |
ibm |
IBM Design Colors |
kx.palette('okabe') returns the hex codes. A list of colours works too: palette=['#264653', '#e9c46a'].
Colourmaps for kx.use(theme, cmap=...) colour continuous values, such as a numeric z in scatter.
Without cmap, the theme's own default applies.
Add _r to any name to reverse it, e.g. cmap="thermal_r".
| Name | Type |
|---|---|
viridis magma plasma inferno cividis |
Sequential, perceptually uniform |
turbo |
Sequential, rainbow |
blues greys |
Sequential, ColorBrewer |
coolwarm |
Diverging |
rdbu |
Diverging, ColorBrewer |
berlin managua vanimo |
Diverging, dark centre |
twilight |
Cyclic, for angles and phases |
thermal haline deep |
Sequential, cmocean (vendored) |
balance |
Diverging, cmocean (vendored) |
batlow lipari hawaii oslo davos |
Sequential, Crameri (vendored) |
vik roma bam cork |
Diverging, Crameri (vendored) |
romaO |
Cyclic, Crameri (vendored) |
kx.cmaps() lists the ones that are available in the installed matplotlib as those implemented in matplotlib 3.10 or newer
are not vendored.
Released under the MIT License. See LICENSE.
Copyright © 2026 Vedran Hrabar
Vendored palettes and colourmaps keep their own licences; see kx/styles/palettes/LICENCES.md
and kx/styles/cmaps/LICENCES.md.