Cytokine signature clusters as a tool to compare changes associated with tobacco product use in upper and lower airway samples
This code was generated to support the manuscript titled 'Cytokine signature clusters as a tool to compare changes associated with tobacco product use in upper and lower airway samples', published in the American Journal of Physiology-Lung Cellular and Molecular Physiology in 2022 (PMID: 35318855).
- Payton AD, Perryman AN, Hoffman JR, Avula V, Wells H, Robinette C, Alexis NE, Jaspers I, Rager JE, Rebuli ME. Cytokine signature clusters as a tool to compare changes associated with tobacco product use in upper and lower airway samples. Am J Physiol Lung Cell Mol Physiol. 2022 May 1;322(5):L722-L736. doi: 10.1152/ajplung.00299.2021. Epub 2022 Mar 23. PubMed PMID: 35318855; PubMed Central PMCID: PMC9054348.
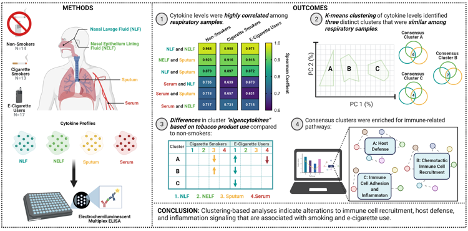
This repository contains code to determine the association between smoking status/ cotinine concentrations and cytokine concentrations. All cytokine compartment analyses in this folder are designated by their figure number or table number in the manuscript in parantheses. In the instance that the files are unable to rendered the NBViewer link can be clicked below.
- Demographics Analysis (Table 1)
- Calculated demographics statistics to determine if there were differences across smoking statuses.
- Descriptive Statistics (Table S1)
- Calculated mean, median, min, max, and standard deviation for the overall cohort, non-smokers, cigarette smokers, and e-cigarette smokers by compartment.
- Baseline Analysis (Figure 1 and Figure S1)
- Calculating and visualizing mean and standard deviation of baseline (non-smokers) concentrations for each cytokine (Figure 1).
- Running Shapiro-Wilk's test for normality between each compartment (NLF, ELF, Sputum, or Serum) at baseline.
- Calculating and visualizing median and standard deviation of baseline (non-smokers) concentrations for each cytokine (Figure S1).
- Spearman Correlations (Table 2)
- Ran Spearman rank correlation tests to determine correlation between each compartment (NLF, NELF, Sputum, Serum) stratified by smoking status.
- Simulation Analysis (Figure 2)
- Performed bootstrapping (simulated 500 concentration data points) to see if randomly generated data would yield similar statistically significant and highly correlated results between each across compartments.
- Cytokine Distribution Comparison (Table S2)
- Using Wilcoxon Rank Sum tests to compare baseline & cigarette smoker distributions or baseline & e-cigarette smokers by compartment
- Cytokine Distribution Comparison (Table S3)
- Used ANOVA test as a crude model (serving as similar function as original Wilcoxon Rank Sum tests) to compare ANCOVA results. ANCOVA was run to control for age.
- Cytokine Demographics Distribution Comparison (Table S4)
- Running Wilcoxon tests like for Table S2, this time further stratifying by demographic variables.
- Baseline Clusters (Figure 3)
- Visualizing clustered kmeans cytokines by compartment
- Baseline Eigencytokine Weights (Figure 4)
- Heat map of NLF cytokines and the weights of cytokines on those clusters at baseline
- Eigencytokine Visualization (Figure 6)
- Heat map of NLF eigencytokines across all smoking groups
- Baseline Eigencytokines (Figure 3)
- Visualizing the amount of variance PCA was able to caputure in the first principal component in NLF cluster A (this was a cluster that had statistically significant differences across smoking groups)
- Eigenvector Weights (Table S5)
- Deriving weights of cytokines on eigenvectors on all data used in this study
- Validation Baseline Clusters (Figure 7)
- Determining if the cytokines in a new (validation) dataset resemble the clusters found in the original dataset
- Cluster Distribution Comparison (Table 4)
- Used Wilcoxon Rank sum test to determine if eigencytokines were significantly different across smoking statuses.